San Francisco House Price Appreciation
Median House Sales Price by Year, 1993 –Present
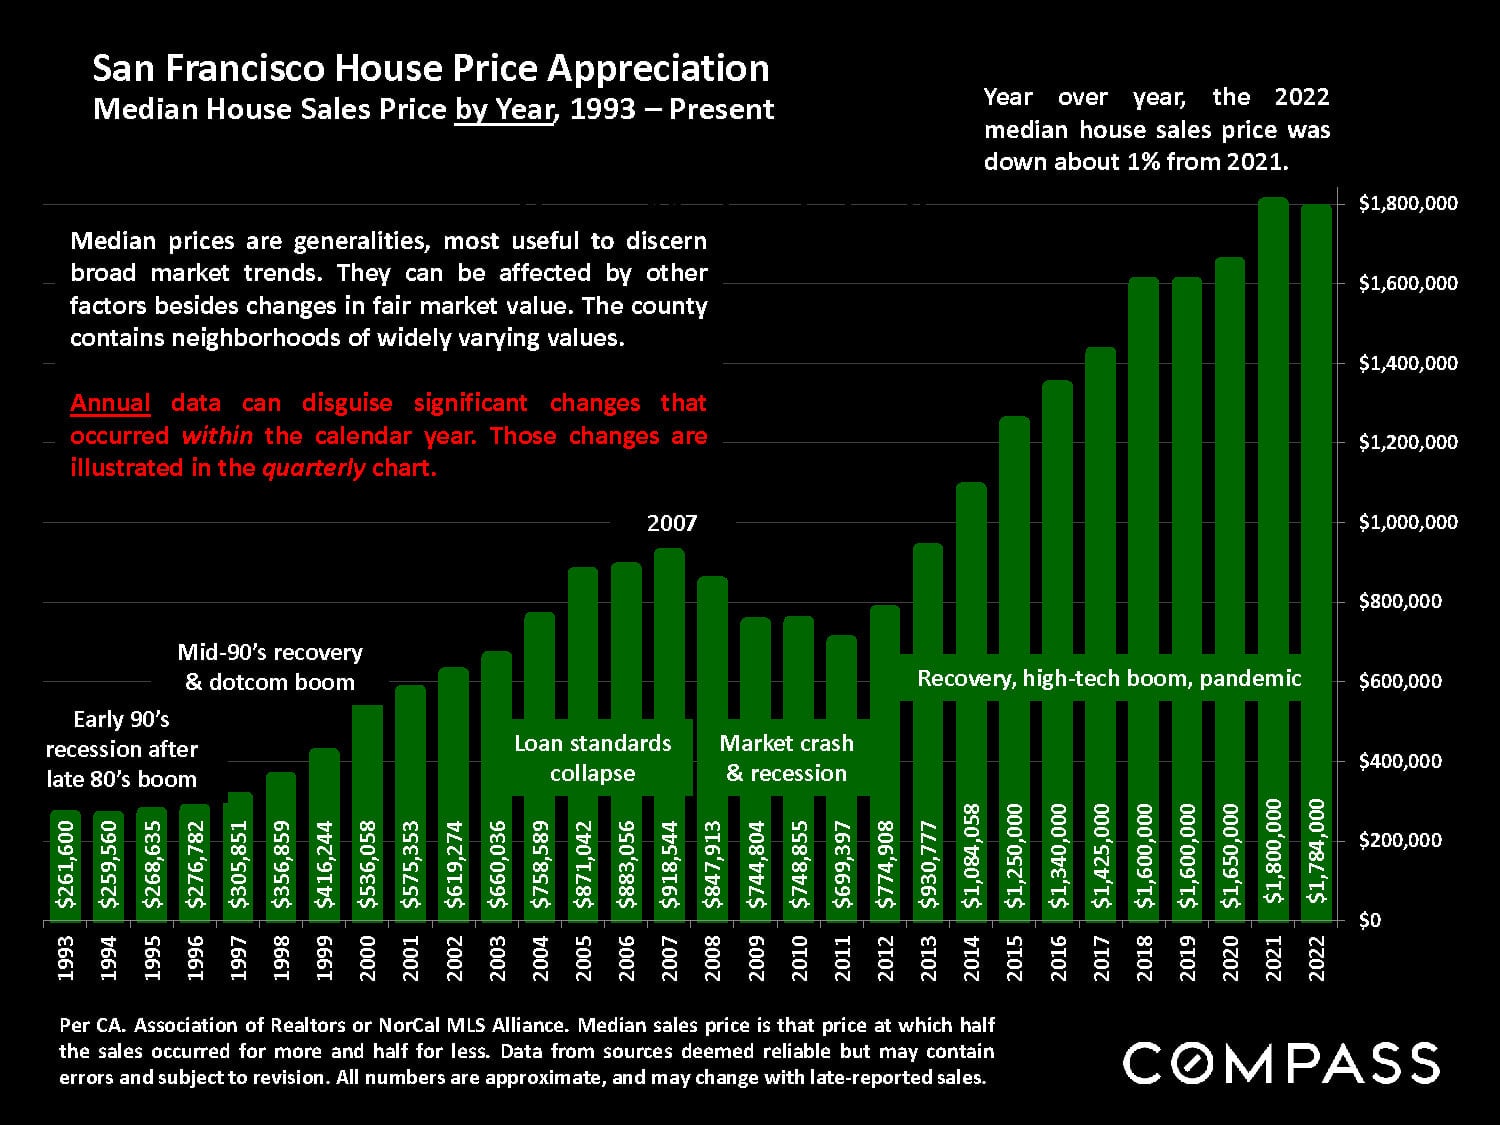
The median sales price by year has been on an upward trend since 2013.
This report will look at the market from a variety of angles, including annual, quarterly and monthly data. Because of the large shifts in the market that occurred between the 1st and 2nd halves of the year, annual data will often changes that occurred with the calendar year. For a deeper dive into real-time market dynamics, a median price quarterly chart is provided below.
San Francisco House Price Trends
Median House Sales Prices, 2012 –Present, by Quarter
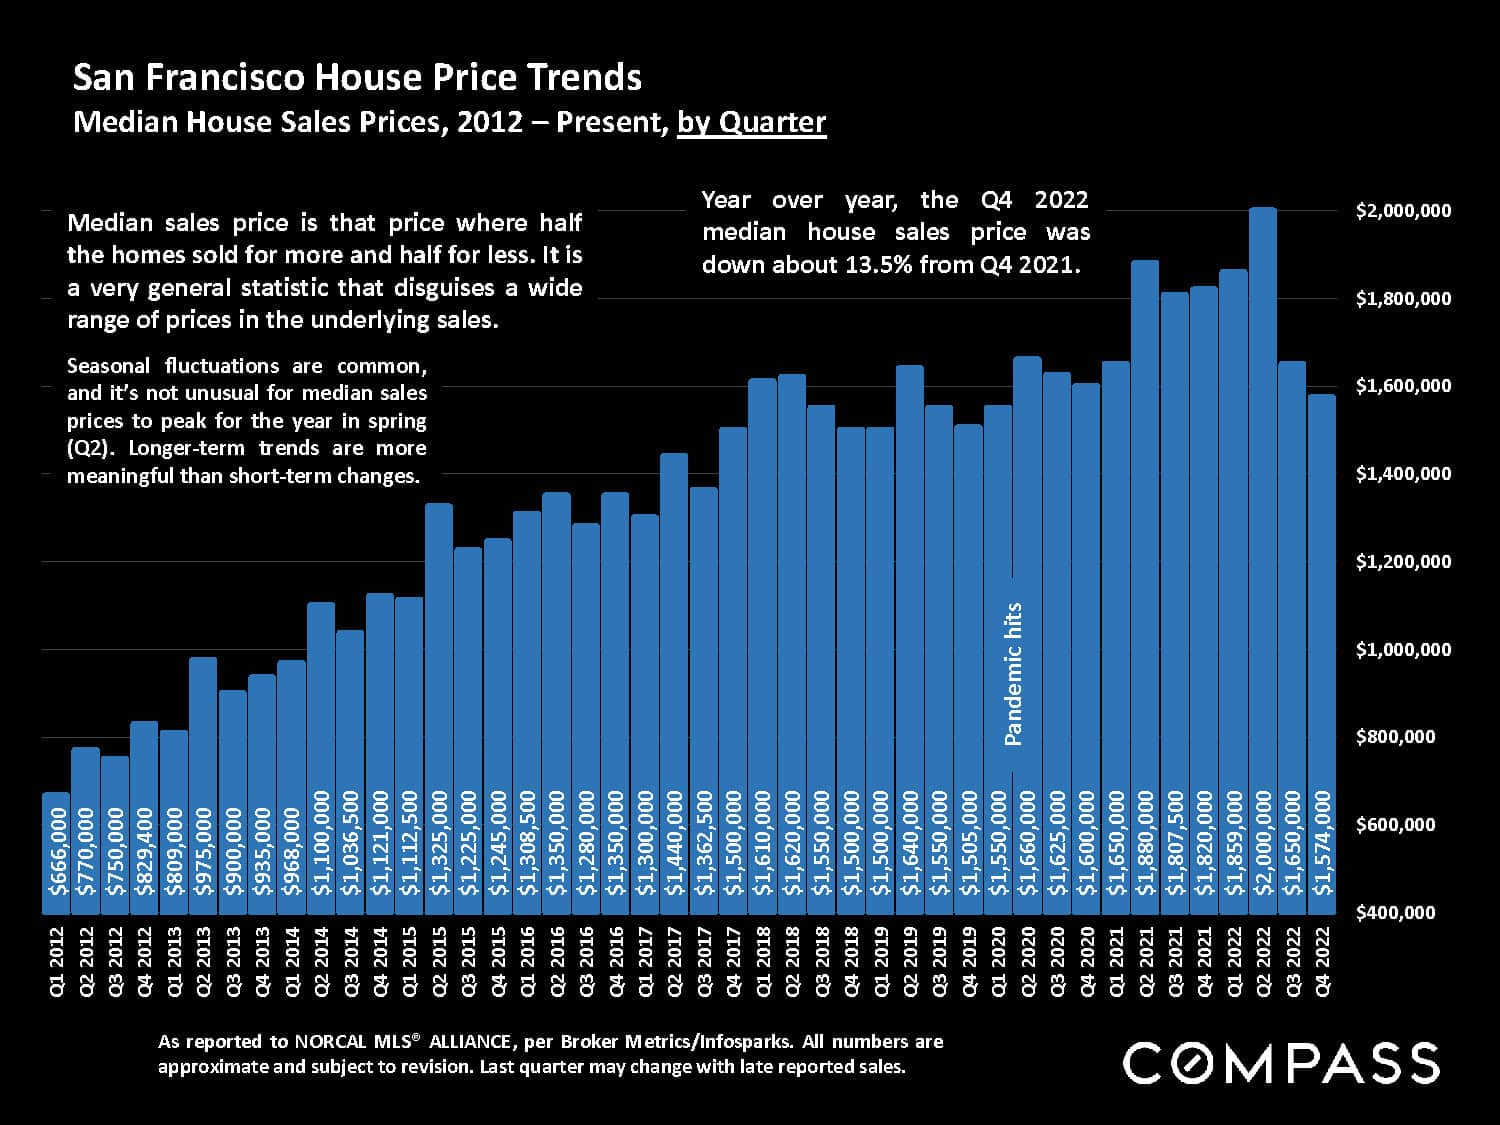
Q4 2022's median single family home price is roughly about the same price as Q1 2020, right before the pandemic was declared.
Real Estate Market Statistics, Comparing Q4 2022 to Q4 2021
- Quarterly Median House Sales Price: Down 13.5% from Q4 2021
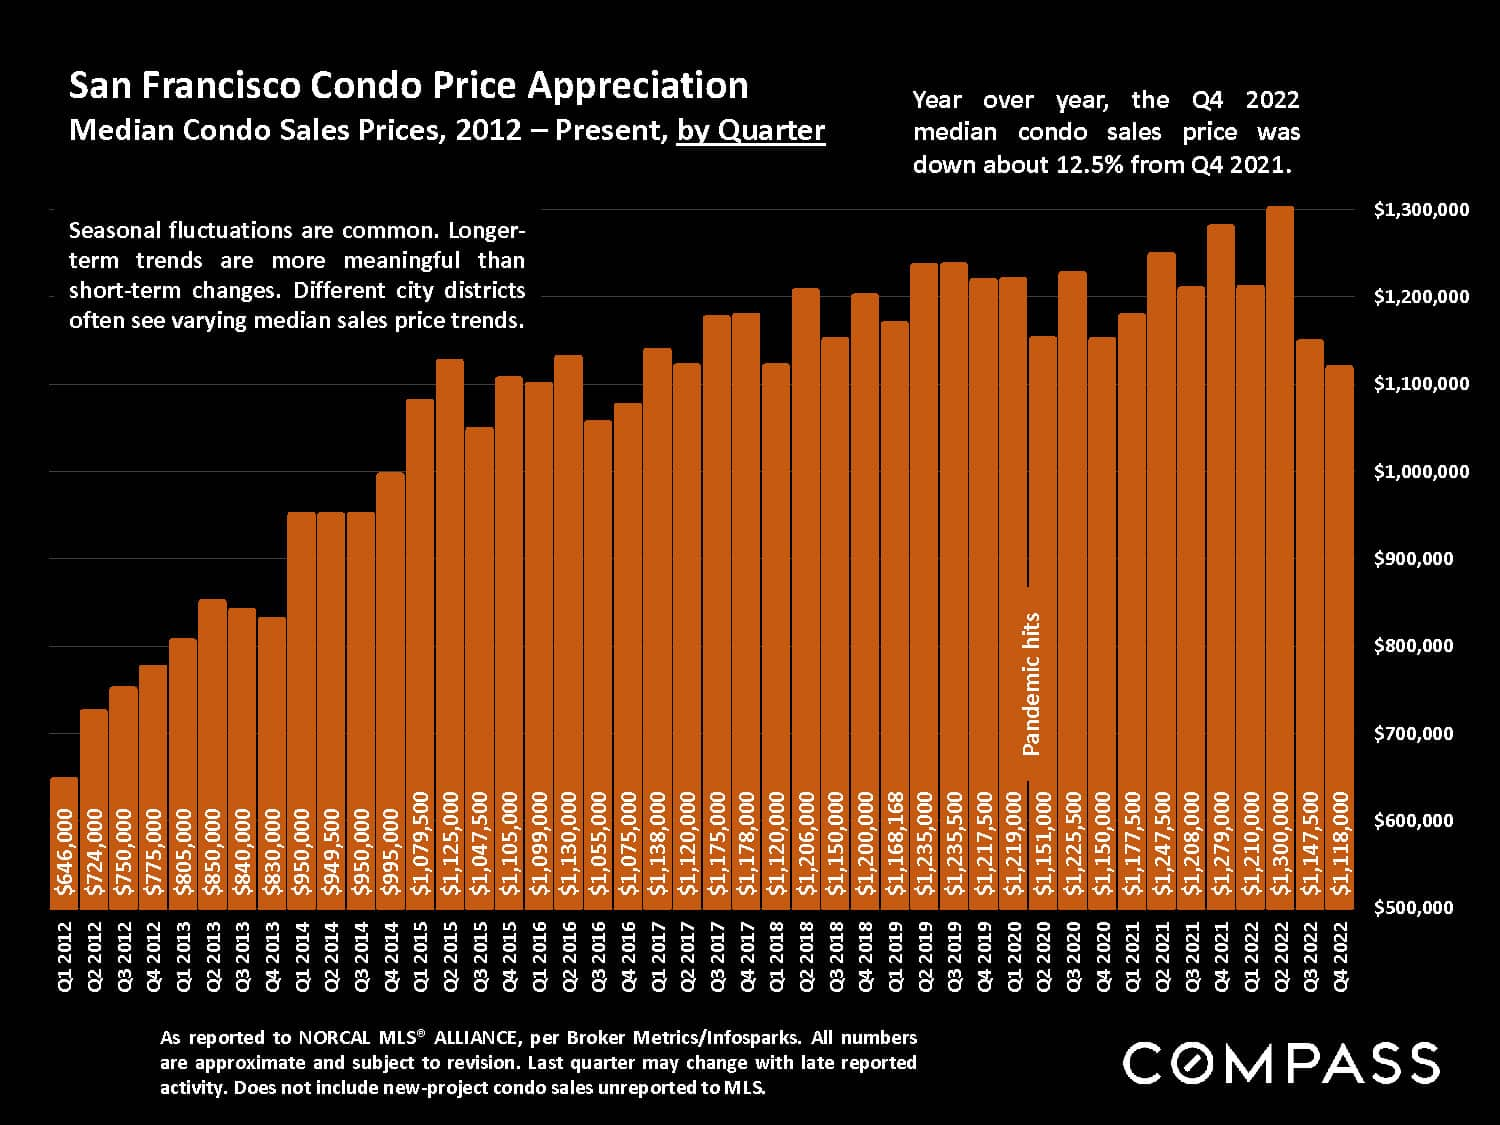
- Quarterly Median Condo Sales Price: Down 12.5% from Q4 2021
- Quarterly Sales Volume: Down 42%
- % of Sales over Final List Price: 43%, down from 66% in Q4 2021
- Avg. Sales Price to Original List Price %: 100% (at list price), down from 108% in Q4 2021
- Average Days on Market: 44 days, up from 34 days in Q4 2021
- Absorption Rate (% of listings into contract): 36% of listings, down from 49% in Q4 2021
- Luxury Home Sales Volume, Sales $3 Million+: Down 52% from Q4 2021
In 2022, the market peaked after a dramatic 10-year upcycle supercharged at its end by the pandemic boom. The market saw a dramatic shift in spring 2022 when it cooled significantly, prompted by a number of economic factors - especially inflation and interest rates, and financial markets. This played out in substantial declines in sales volumes, median sales prices, appreciation rates, and virtually all the standard measurements of buyer demand.
However, some buyers are making the best deals in years. For sellers, pricing, preparation and marketing are now critical. Tens of thousands of Bay Area homes continued to sell in the second half on 2022 and a considerable, but lower percentage still sold quickly at over asking price. On the other hand, buyers shouldn’t hesitate to negotiate aggressively, especially on homes with longer days-on-market.
The early spring market – which, weather cooperating, can begin as early as February in the Bay Area – would typically provide the next major indicator of market direction, but developments may occur sooner to provide increased clarity regarding what awaits us in 2023. For the time being, the market remains in a period of adjustment, with major macroeconomic conditions still in flux.
Major Economic Indicators in 2022
- Weekly Avg. 30-Year Mortgage Rate: Climbed from 3.11% to 6.42% (but is down from 7.08% peak in November 2022)
- Consumer Price Index (inflation rate): January to November, dropped from 7.5% to 7.1% (It is down from 9% peak in June 2022, but up from 1.4% in January 2020.)
- S&P Stock Index: Opening to closing bell in 2022, down approximately 19.4%
- Nasdaq Stock Index: Opening to closing bell in 2022, down approximately 33.5%
- Employment: Bay Area unemployment rates remain close to historic lows. (According to the WSJ, “Most laid off tech workers are finding jobs shortly after beginning their search”).
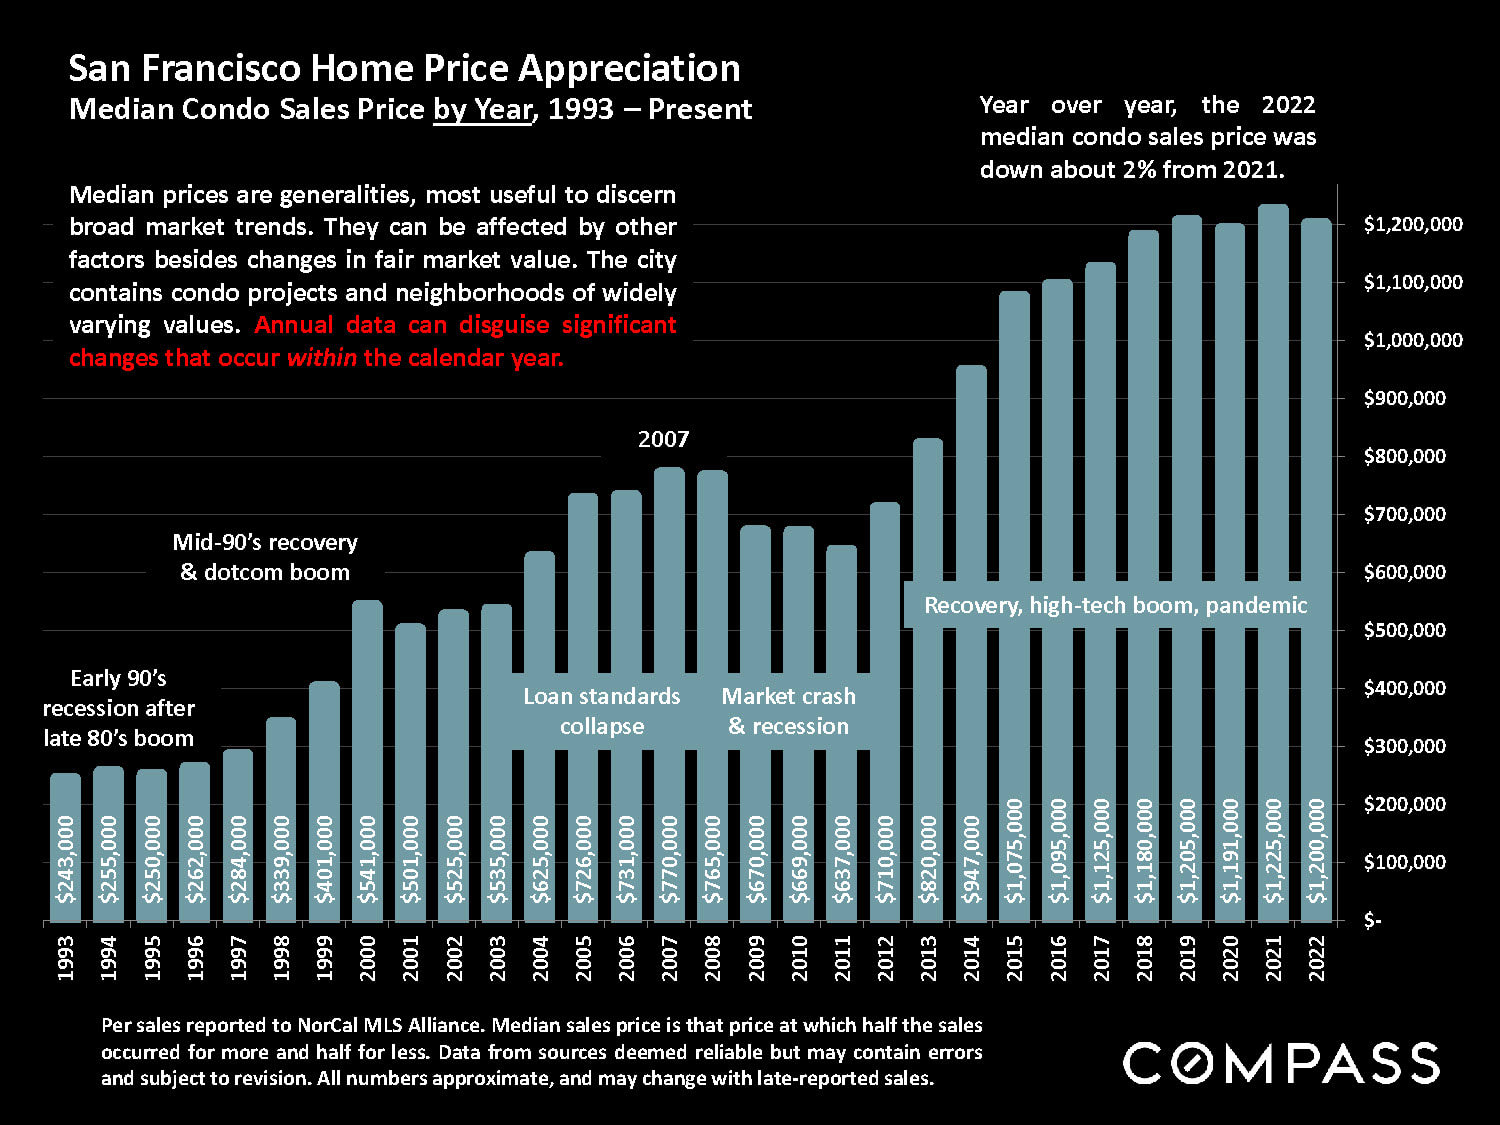
San Francisco Home Price Appreciation
Median Condo Sales Price by Year, 1993 –Present
San Francisco Condo Price Appreciation
Median Condo Sales Prices, 2012 –Present, by Quarter